

The Awaio admin portal includes five report types, each designed to answer different questions about how your community uses its spaces and resources. All reports require the Reports admin role.
Overview of the reports section
The Reports section is accessible from the left navigation bar. It contains the following reports:
- Booking Insights — pattern analysis of booking data
- Occupancy Overview — resource occupancy charts and heatmaps
- Monthly Bookings — daily and weekday booking distribution by month
- Lock Openings — a per-event log of lock access
- Booked Locks Usage — active bookings with lock usage activity
Booking Insights
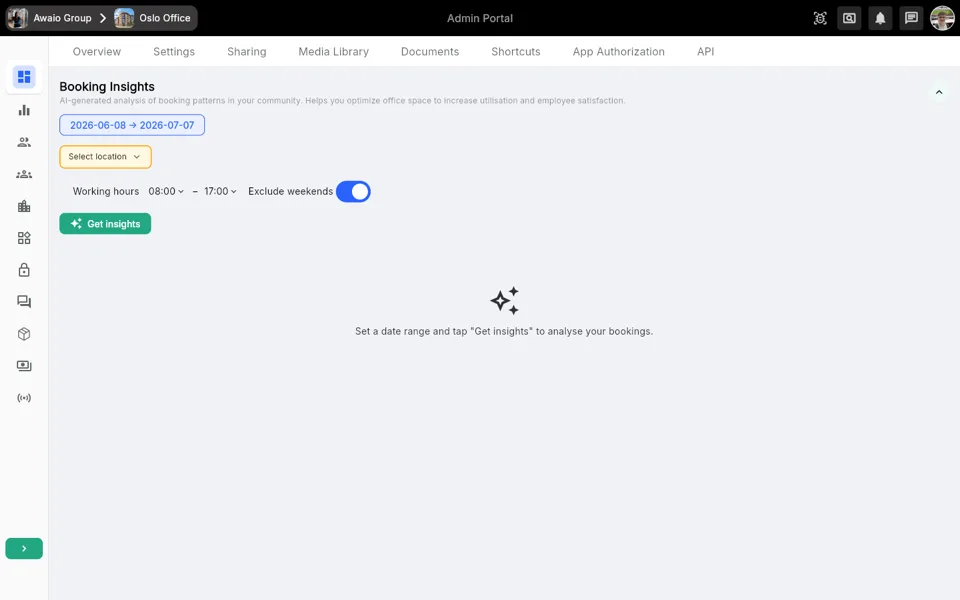
Booking Insights analyses booking patterns across your community and surfaces categorised findings such as peak usage periods, low-utilisation opportunities, anomalies, and recommendations.
How to generate insights
- Open Reports in the left navigation bar and select Booking Insights.
- Click the date range button and choose a start and end date for the analysis period. A date range is required before insights can be generated.
- Optionally, select a location from the location dropdown.
- Use the Type dropdown to filter by resource group (e.g. desks, meeting rooms). After selecting a type, Sub-type and Resource filters become available.
- Adjust the Working hours start and end times to restrict the analysis to your office hours.
- Toggle Exclude weekends on or off as needed.
- Click Get insights. Results appear as insight cards below the filter bar.
Reading insight cards
Each card displays a coloured category badge (for example, PEAK USAGE, OPPORTUNITY, BOOKING PATTERN, ANOMALY, or RECOMMENDATION), a title, a description, and a recommended action. Click any card to open a detail dialog with additional information.
When to use this report
Use Booking Insights when you want a high-level analysis of booking trends over a custom period — for example, to identify underused resources or recurring demand spikes before making space planning decisions.
Occupancy Overview
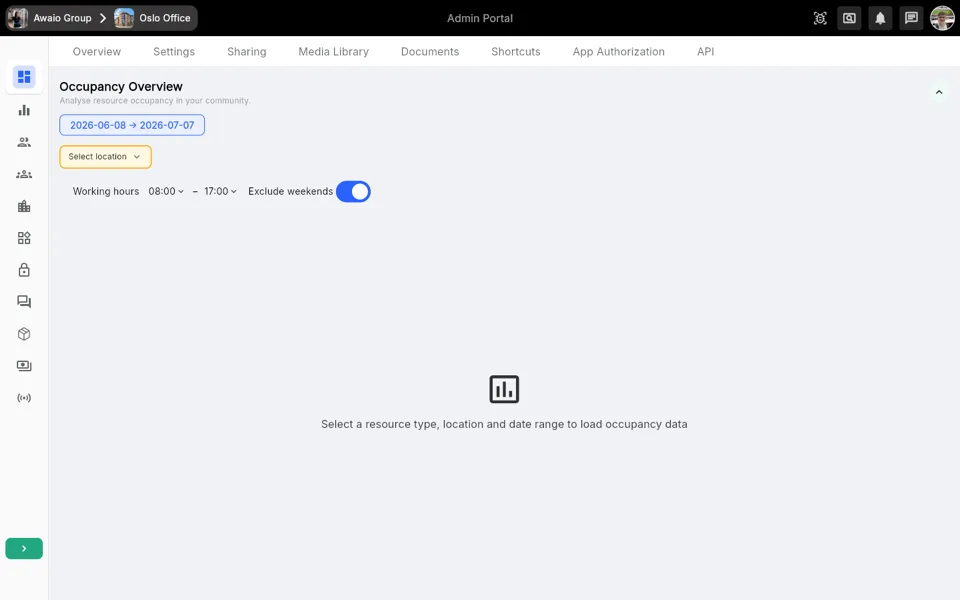
Occupancy Overview shows resource occupancy data as charts. If the selected location has an office map configured, the view also includes a Heatmap tab alongside the Charts tab.
How to load occupancy data
- Open Reports and select Occupancy Overview.
- Click the date range button and select a date range.
- Select a location from the location dropdown. This field is highlighted when no location is chosen.
- Use the Type dropdown to choose a resource group. Sub-type and resource filters appear once a type is selected.
- Optionally pick specific resources using the Resource filter pill.
- Set the Working hours range and toggle Exclude weekends as required.
- The charts load automatically once a resource type, location, and date range are all set.
Heatmap and Charts tabs
When the selected location has an office map, two tabs appear: Heatmap and Charts. The heatmap overlays occupancy data on the floor plan. The charts tab displays the same data as graphs. Switch between tabs using the tab bar above the content area.
If your data includes both booking-based and sensor-based occupancy, a Booking Occupancy / Sensor Occupancy toggle appears in the filter bar, allowing you to switch between the two data sources.
When to use this report
Use Occupancy Overview to compare how different resources, locations, or time periods perform — for example, to see which meeting rooms are consistently over- or under-booked.
Monthly Bookings
Monthly Bookings displays booking volume across a selected calendar month, broken down by day and by weekday.
How to view monthly booking data
- Open Reports and select Monthly Bookings.
- Use the month selector in the top-right corner to choose the month you want to view.
- Optionally use Add filter to narrow the data.
- The chart area updates to show two charts for the selected month.
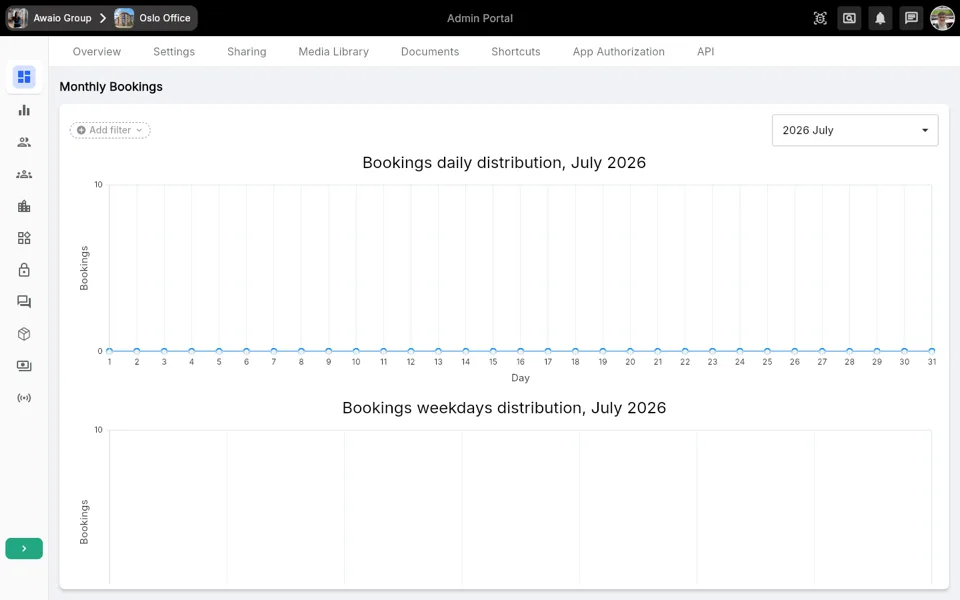
The Bookings daily distribution chart plots the number of bookings for each day of the month. The Bookings weekdays distribution chart aggregates bookings by day of the week, making it easy to identify which weekdays are busiest.
When to use this report
Use Monthly Bookings to track overall booking volume trends month by month — for example, to spot a drop in bookings during a particular period or to understand typical weekly demand patterns.
Lock Openings
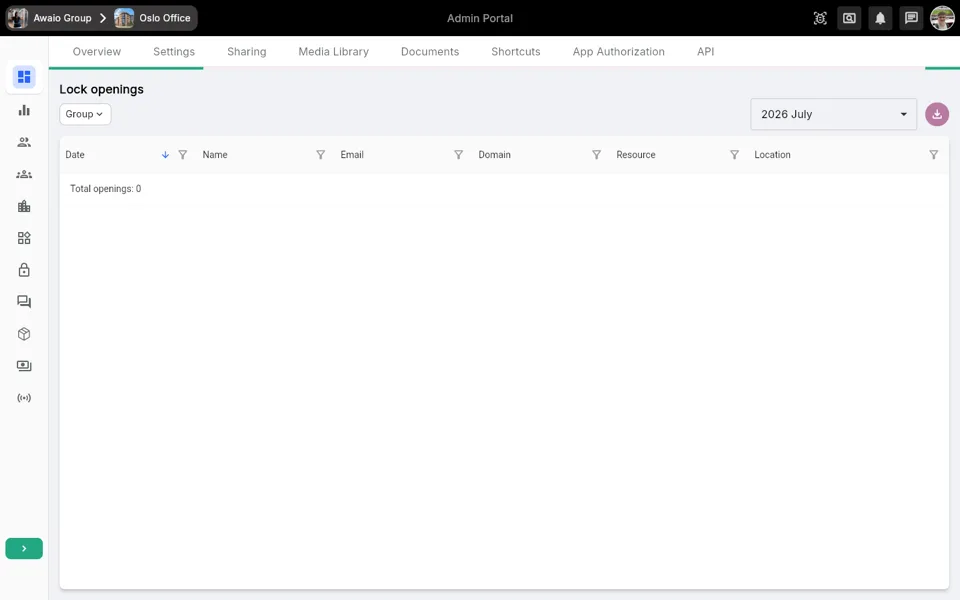
Lock Openings is a detailed event log showing every lock opening event within a selected month. It is useful for auditing physical access to resources.
How to view lock opening data
- Open Reports and select Lock Openings.
- Use the month selector in the top-right corner to choose the month.
- The table populates with one row per lock opening event, showing the following columns: Date, Name, Email, Domain, Resource, and Location.
- Click the column header filter icons to filter rows by any column value.
- Click the Group dropdown to group rows by one or more columns (for example, by domain or resource).
- Click the export button (download icon) in the top-right corner to export the data.
When to use this report
Use Lock Openings to audit who accessed a particular resource and when — for example, to investigate unexpected access or to verify that a booked locker is being used.
Booked Locks Usage
Booked Locks Usage shows all active bookings for resources that have a lock, including when the lock was last used and the total number of openings for each booking.
How to view booked locks usage
- Open Reports and select Booked Locks Usage.
- The table loads automatically and displays active bookings with lock-enabled resources.
- Review the last used date and total openings columns to identify bookings where the lock has not been used recently.
- Where available, you can send a reminder to the booking holder directly from this view.
When to use this report
Use Booked Locks Usage to identify resources that are booked but not actively being accessed — for example, to follow up with members who may have forgotten about a long-term locker booking.
Tips
- Booking Insights requires a date range before the Get insights button becomes active. All other filters are optional.
- Occupancy Overview requires a resource type, location, and date range to be set before data loads.
- Use the Exclude weekends toggle on Booking Insights and Occupancy Overview to focus analysis on working days only, which can significantly affect average occupancy figures.
- The Working hours filter on both Booking Insights and Occupancy Overview lets you restrict analysis to the hours your office is typically open, preventing off-hours bookings from skewing results.
- Lock Openings data can be exported to a file using the export button — useful for sharing access logs with security or facilities teams.
- If no data appears in Monthly Bookings or Lock Openings, confirm that the selected month and community match where your resources and bookings are configured.